Corporate
In Production
2026
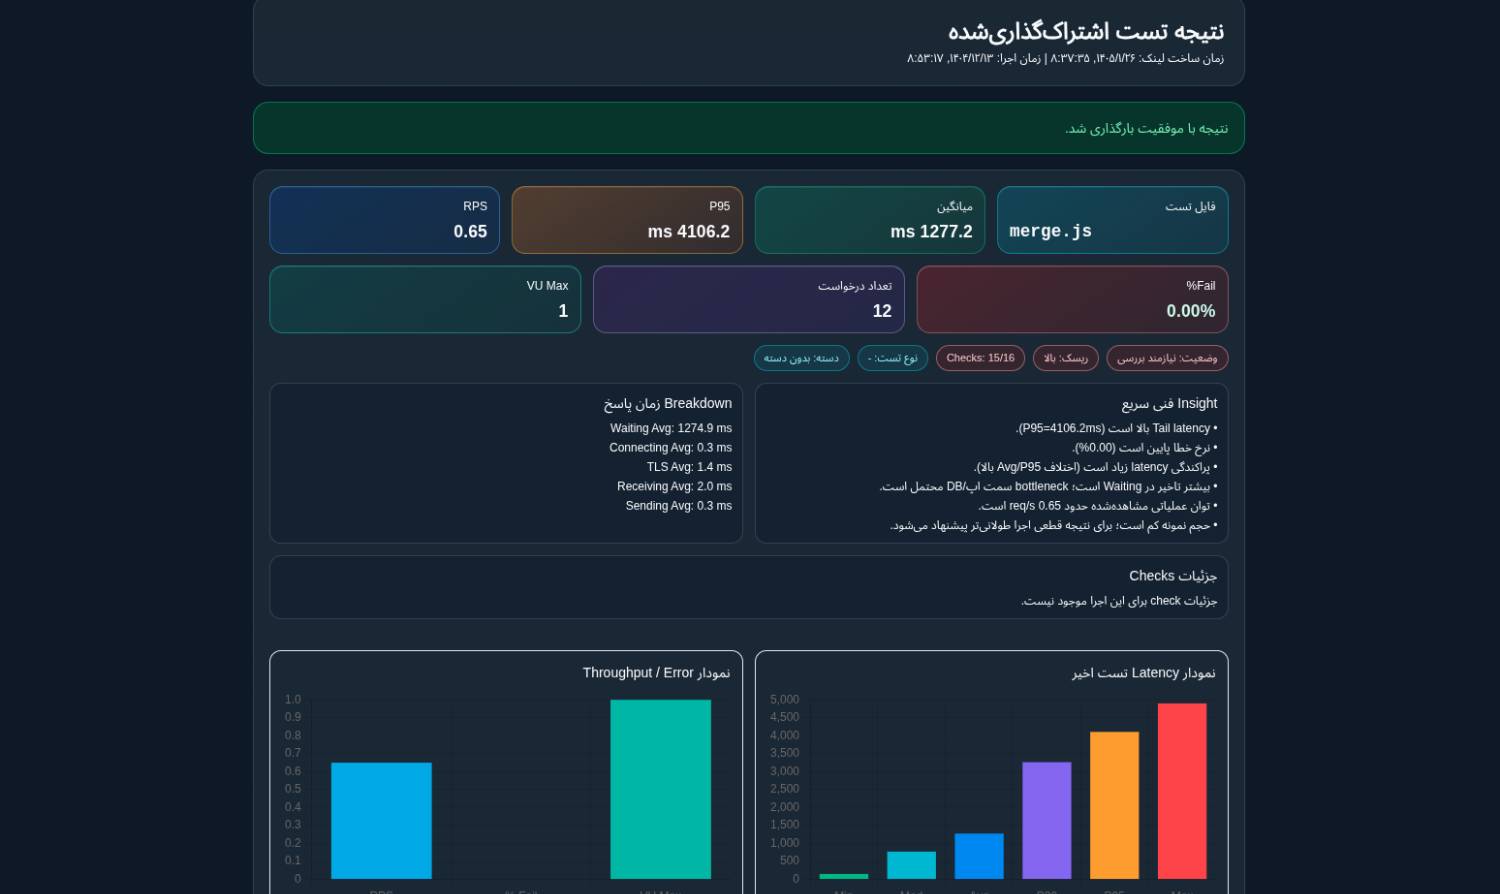
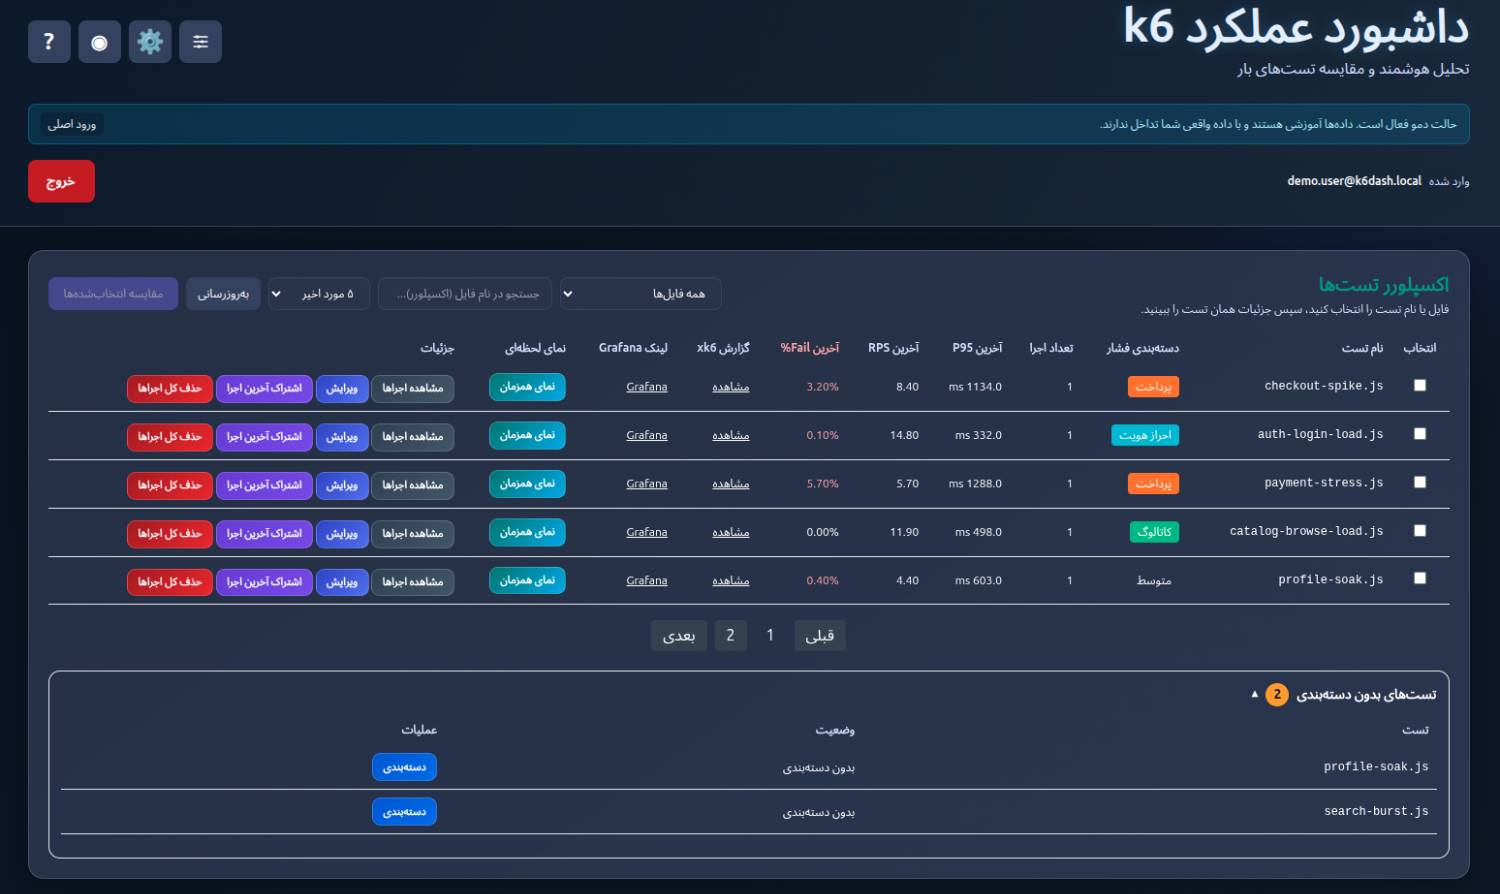
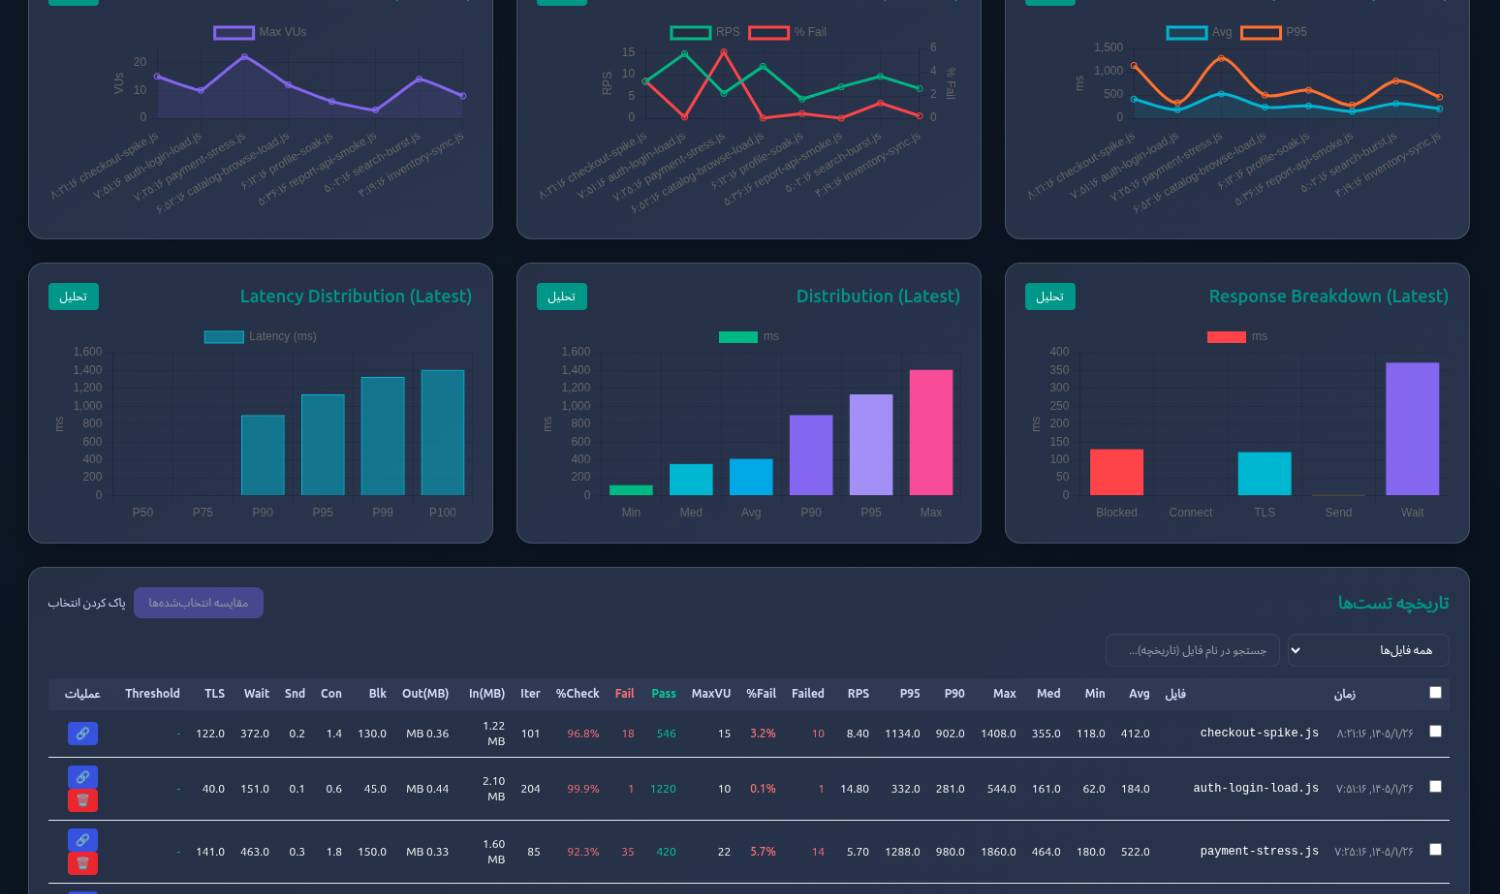
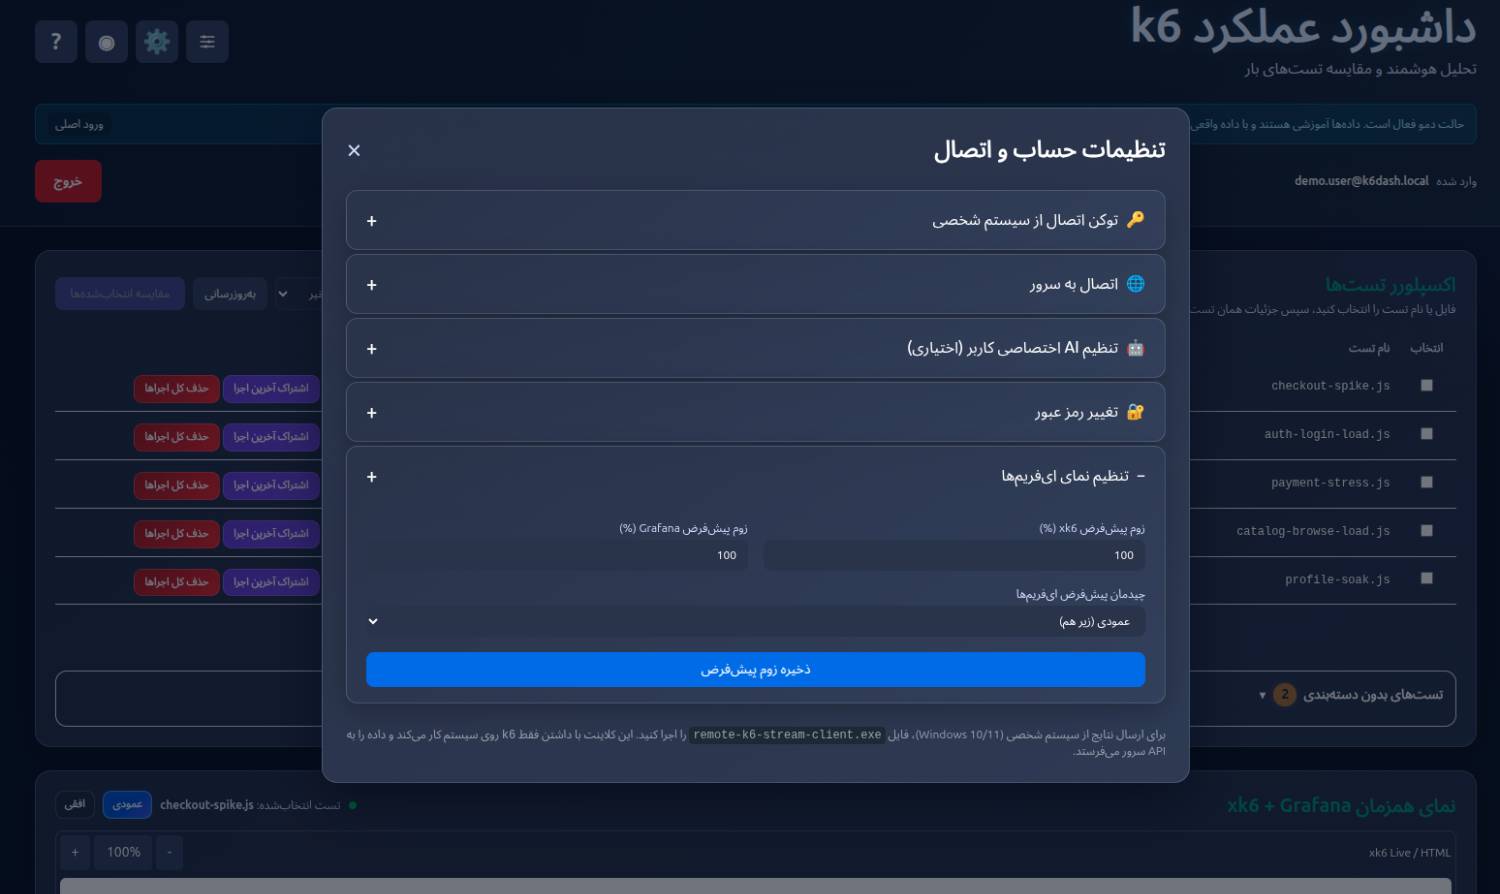
k6 Live Dashboard
A comprehensive real-time dashboard for monitoring k6 load tests. Built to handle thousands of concurrent data points with WebSocket streaming, providing instant visibility into system performance during stress testing scenarios. The dashboard enables teams to make data-driven decisions during critical testing phases.
Role
Full Stack Developer & QA Engineer
Duration
6 months